JM Momentum Moving Average CrossoverReuploaded.
Some people complained about noisy signals from previous gainzy inspired intraday indicator so have designed this one to be more robust. Is pretty good at capturing early trend changes in momentum. Have not backtested yet. Recommended for lower time frames, 1 hour and under, I like 45m.
How it works?
____________
Using custom fast and slow momentum factors it is simply a crossover of the two.
How to use?
____________
Wait for closing bar, if BUY signal is printed, momentum is trending upwards so longs are favoured. If SELL signal is printed, shorts are favored.
在脚本中搜索"moving average crossover"

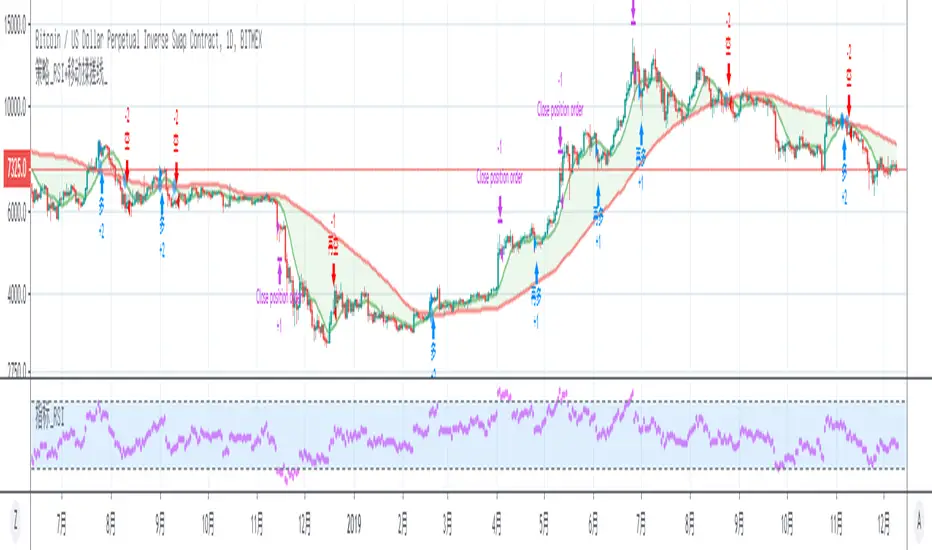
SMA_Cross + RSI1. long
a. RSI does not open an order when it is overbought, until the RSI falls below a certain threshold, and then open a position
b. There are already many positions. If the RSI is overbought, it will be profitable. When the RSI falls below a certain threshold, open a long position again until the moving average crossover signal turns short.
2. Short
a. RSI does not open an order when it is oversold, and then opens a position after RSI rises to a certain threshold
b. There are already short positions. If the RSI is oversold, it will be profitable to close the short position. When the RSI rises above a certain threshold, open the short position again until there is a reversal of the moving average crossing signal.
1. 做多
a. RSI在超买区间时不开单,直到RSI回落到某个阈值之下,再开仓
b. 已经有多仓,如果RSI超买,则平多获利,当RSI回落到某个阈值之下后,再次开多,直到有均线交叉信号反转做空
2. 做空
a. RSI在超卖区间时不开单,直到RSI上升到某个阈值之后,再开仓
b. 已经有空仓,如果RSI超卖,则平空获利,当RSI上升到某个阈值之上后,再次开空,直到有均线交叉信号反转做多
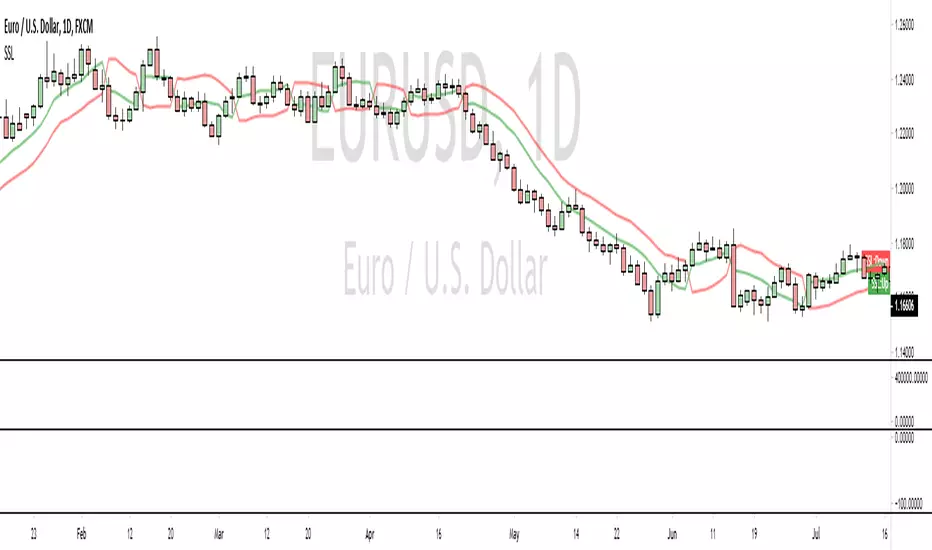
SSL [dasanc]The SSL is a fair entry condition and good exit indicator. It works best when combined with a trend indicator and multiple confirmations.
In essence, the SSL is a moving average crossover, which immediately down-grades it to a 2nd or 3rd level of confluence in my opinion.
It was recently featured in an episode of VP's "No Nonsense FX", which drove me to recreate the original MT4 indicator in PineScript.
I have two ideas on how to improve it -
Use a much faster moving average calculation method (check out my Ehlers scripts)
Use a longer period MA on lower timeframes
If you enjoy/use this script, drop me a follow and please note me in your code!
I'm *almost* always available for collabs and questions
(JS) Moving Average Secuirty OscillatorThis is kind of like the Moving Average Crossover Oscillator - except this measures in % the distance between the security you're charting and the MA you have entered in.
The goal is to see when the price pulls too far from the MA.
Hope you like it!


Triple Moving Average Crossover IndicatorGo Long as the fastMA crosses above the slowMA (All Green Fill)
Go Short as the fastMA crosses below and other MA (Red)
Prep for next movement when the fill colours are mixed together.
Back this up with volume and momentum indicators.
I'm currently working on turning this into a strategy.
Please let me know what you think, as this is my first indicator.

Hausky Simple MA Strategy EURUSD 1HHere is my simple Moving Average crossover strategy for EURUSD 1H

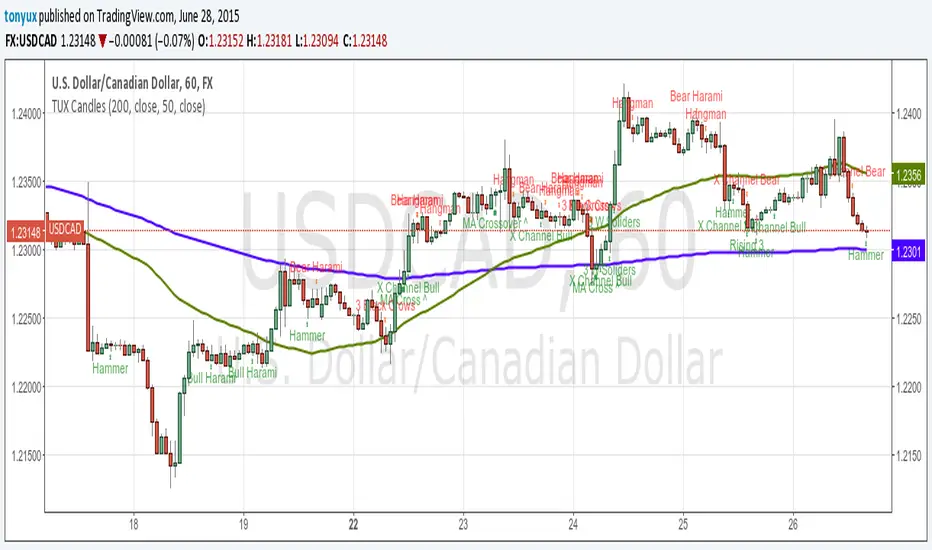
TUX CandlesThis indicator has a lot of information. This is the first version so stay tuned for updates, and please let me know of any bugs.
Candlestick Indicators:
Doji
Shooting Star
Evening Star
Hammer
Hanging Man
Candlestick Formations
Tri-star
Bearish Harami
Bullish Harami
Bearish Harami Cross
Bullish Harami Cross
Bullish Engulfing
Bearish Engulfing
Rising Three
Falling Three
Bearish Abandoned Baby
Bullish Abandoned Baby
Three Black Crows
Three White Soldiers
Technical Indicators:
(You can set you MA periods)
Moving Average Cross
Move Average Crossover
Peace of Mind Trader: MA Trend SystemPeace of Mind Trader: MA Trend System
ระบบนี้ถูกออกแบบมาเพื่อให้การดูเทรนด์เป็นเรื่องง่ายและ "สบายใจ" ที่สุด (Peace of Mind) โดยลดความซับซ้อนของการตีเส้นกราฟ ช่วยให้คุณโฟกัสกับภาพใหญ่ของตลาดได้ทันที ด้วยหลักการ EMA Cross ที่เรียบง่ายแต่ทรงพลัง
ฟีเจอร์หลัก:
- Trend Ribbon (แถบสีบอกเทรนด์): แสดงพื้นที่ระบายสีระหว่างเส้น EMA สองเส้น เปลี่ยนสีเขียว/แดงตามแนวโน้ม ช่วยให้มองแวบเดียวก็รู้ว่าตลาดเป็นขาขึ้นหรือขาลง
- สัญญาณซื้อขายที่ชัดเจน:
ขึ้นป้าย "🟢 BULL" เมื่อเริ่มเข้าสู่เทรนด์ขาขึ้น
ขึ้นป้าย "🔴 BEAR" เมื่อเริ่มเข้าสู่เทรนด์ขาลง
- พิเศษ: มีฟังก์ชัน "Show Signal History" สามารถเลือกปิดประวัติเก่าๆ เพื่อให้โชว์แค่ "สัญญาณล่าสุด" เพียงอันเดียวได้ (ทำให้กราฟสะอาดตามาก)
- Dashboard สถานะ: ตารางสรุปมุมขวาล่าง (ปรับตำแหน่งได้) บอกสถานะปัจจุบันทันทีว่าควร Buy หรือ Sell
- เปลี่ยนสีแท่งเทียนอัตโนมัติ: ระบบจะย้อมสีแท่งเทียนให้เป็นสีเขียว/แดงตามเทรนด์ เพื่อลดความสับสนช่วงที่กราฟย่อตัว
วิธีใช้งาน:
🟢 โซนสีเขียว: โฟกัสหน้า Buy หรือถือรันเทรนด์ต่อไป
🔴 โซนสีแดง: โฟกัสหน้า Sell หรือถือเงินสดรอจังหวะ
การตั้งค่า: สามารถปรับค่า EMA และสีต่างๆ ได้ตามสไตล์การเทรดของคุณ
ขอให้มีความสุขกับการเทรดแบบ Peace of Mind ครับ
พีร์ Peace of Mind Trader
-------------
English Description
Peace of Mind Trader: MA Trend System
This indicator is designed to simplify your trading routine by visualizing the market trend clearly and effectively. Built on the classic logic of Moving Average crossovers (EMA), it helps you stay on the right side of the market without the noise.
Key Features:
Trend Ribbon: A visual fill between the Fast and Slow EMA that changes color based on the trend (Green for Bullish, Red for Bearish). This makes it easy to spot the strength and direction of the trend at a glance.
Clear Buy/Sell Signals:
Displays "🟢 BULL" labels when the Fast EMA crosses above the Slow EMA.
Displays "🔴 BEAR" labels when the Fast EMA crosses below the Slow EMA.
New Feature: You can toggle "Show Signal History". Uncheck this option to keep your chart clean by showing only the latest active signal.
Status Dashboard: A customizable panel on the chart (position adjustable) that tells you the current market status immediately (BULL or BEAR).
Trend-Colored Candles: Automatically colors the candlesticks to match the trend, helping you filter out noise during corrections.
How to Use:
Green Zone (Bullish): Look for buying opportunities or hold your position (Run Trend).
Red Zone (Bearish): Look for selling opportunities or stay in cash.
Settings: You can adjust the EMA lengths and all visual colors to fit your personal trading style.
Trade with Logic, Profit with Peace.

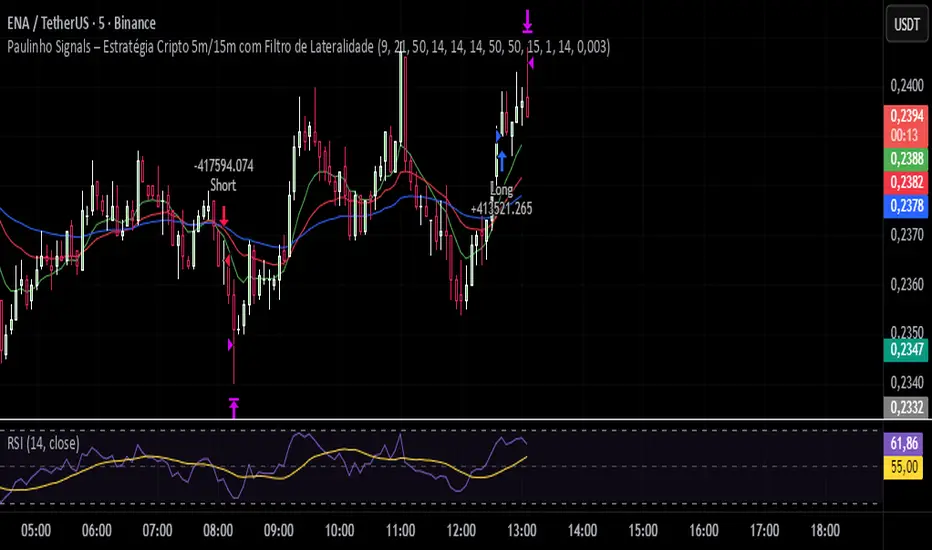
Paulinho Signals – Cripto 5m/15m com Filtro de LateralidadeThis script is an automated Pine Script v6 strategy designed for short-term cryptocurrency trading, especially on 5-minute and 15-minute timeframes. It combines moving average crossovers, trend strength (ADX), volatility (ATR), and candlestick patterns to generate buy and sell signals with a fixed risk/reward management system.
How to Use:
- Apply to cryptocurrency charts on 5m or 15m timeframes.
- Adjust parameters to fit your preferences (EMA, RSI, ADX, ATR).
- Use for backtesting or as a decision-support tool.
Disclaimer:
This script is for educational purposes only and does not constitute financial advice. Always test on demo accounts before applying to live trading.
Teckmann Ribbon ScalperA scalping indicator is a technical tool designed to provide quick, high-probability trade signals in short timeframes, typically 1–5 minutes. It identifies immediate market opportunities by detecting rapid price movements, trend direction, and potential reversals. Common features include moving average crossovers, momentum oscillators, and price action patterns, often enhanced with visual cues like arrows or alerts for instant buy or sell entries. The goal is to maximize small, frequent profits while minimizing exposure to market noise.Follow the signal at the close of 2nd or 3rd candle after the ribbon changes.

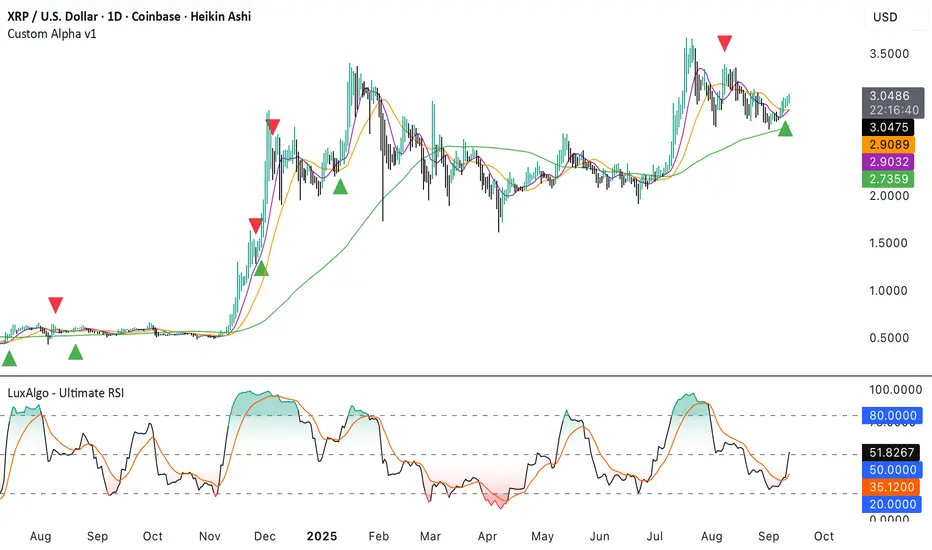
Custom Alpha v1Heiken Ashi based indicator using moving average crossovers combined with LuxAlgo Ultimate RSI with custom weighting to trigger buy and sell signals.
Settings for weightings and signal threshold are fully customizable in the indicator settings.
SMAs can be toggled on/off under the style tab of indicator settings.
Alpha v1Heiken Ashi based indicator using moving average crossovers combined with LuxAlgo Ultimate RSI with custom weighting to trigger buy and sell signals. SMAs can be toggled under the style tab of indicator settings.
For 30m time frame SMAs:
First Period = 9
Second Period = 21
Third Period = 100
All other time frame SMAs:
First Period = 21
Second Period = 50
Third Period = 200

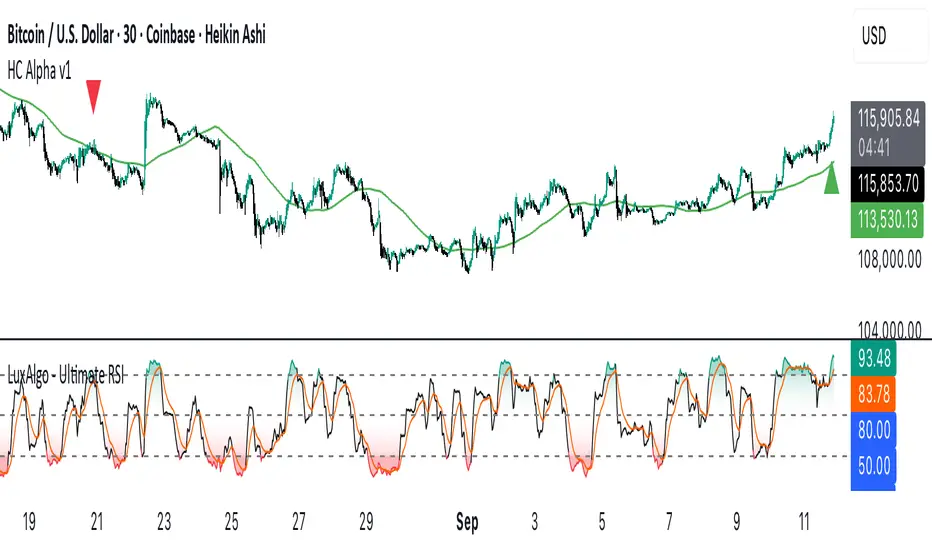
HC Alpha v1Heiken Ashi based indicator using moving average crossovers combined with LuxAlgo Ultimate RSI with custom weighting to trigger buy and sell signals. Best used on 30m / 6h time frames. Signals on 30m chart require same trend on 6h. 3d signals is another option but not as consistent. 3d is useful to look for entries on 6h chart.
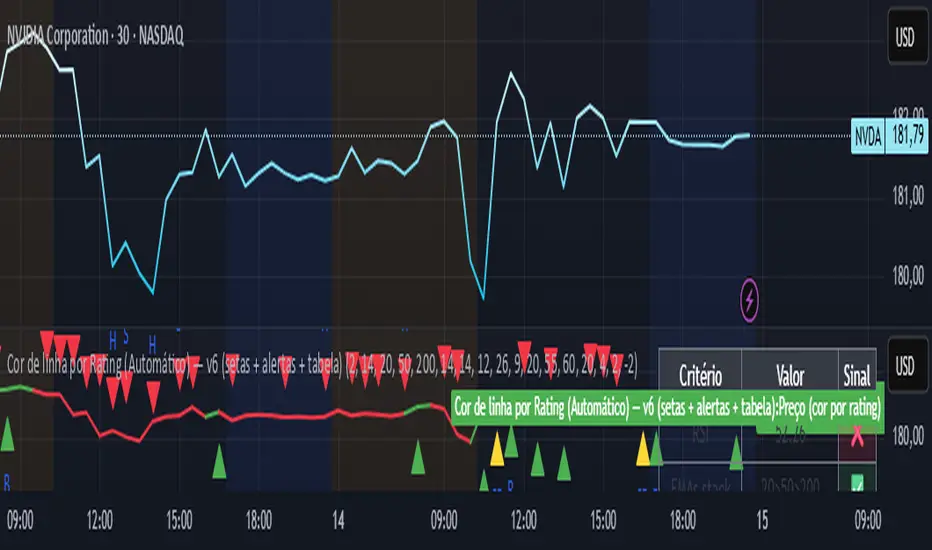
Line color best indices grouped by Artificial Intelligence
The script uses the best buy indicators, such as moving average crossovers, RSI, and others selected by AI. The idea is to determine whether the stock is classified as a strong buy (yellow line), a buy (green line), or a red (sell)
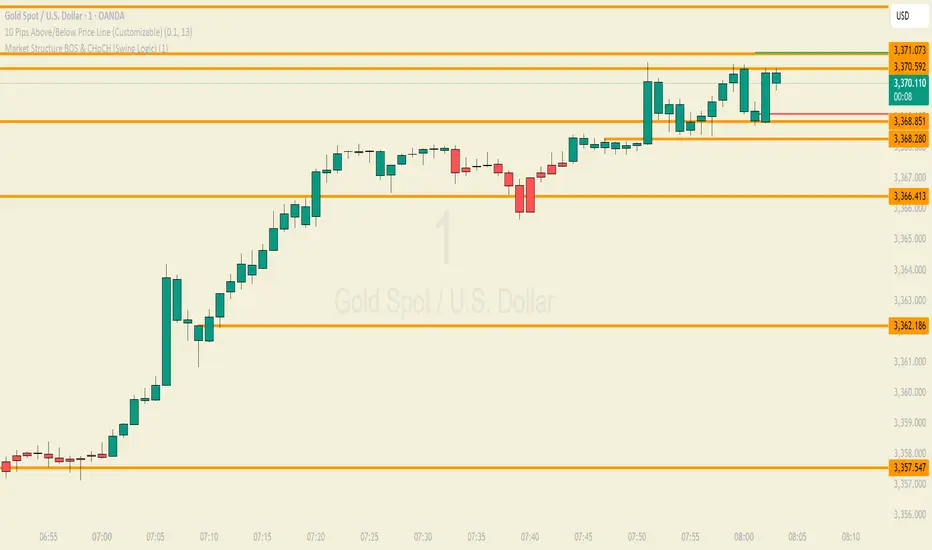
Easy Market Structure BOS & CHoCH (Swing Logic)A trend reversal occurs when the direction of the market changes from an uptrend to a downtrend or vice versa. It is typically confirmed by a shift in price structure, such as a break of key support or resistance, a change in swing highs/lows, or specific candlestick patterns like engulfing or pin bars. Indicators like RSI divergence or moving average crossovers can also support reversal identification. Reversals often follow a strong trend and signal a potential new direction in price movement

easy Market Structure BOS & CHoCH (Swing Logic)
A trend reversal occurs when the direction of the market changes from an uptrend to a downtrend or vice versa. It is typically confirmed by a shift in price structure, such as a break of key support or resistance, a change in swing highs/lows, or specific candlestick patterns like engulfing or pin bars. Indicators like RSI divergence or moving average crossovers can also support reversal identification. Reversals often follow a strong trend and signal a potential new direction in price movement
easy market structure finderA trend reversal occurs when the direction of the market changes from an uptrend to a downtrend or vice versa. It is typically confirmed by a shift in price structure, such as a break of key support or resistance, a change in swing highs/lows, or specific candlestick patterns like engulfing or pin bars. Indicators like RSI divergence or moving average crossovers can also support reversal identification. Reversals often follow a strong trend and signal a potential new direction in price movement

Stop Loss & Take Profit For Overlay Indicators[LePasha] Stop Loss & Take Profit For Overlay Indicators
This indicator helps traders easily visualize Stop Loss (SL) and Take Profit (TP) levels based on custom buy and sell signals from any overlay indicators or price-based sources.
Key Features:
Accepts buy and sell signals from any indicator or price source on your chart.
Automatically calculates SL and TP levels using ATR-based volatility for dynamic risk management.
Allows customization of capital, risk percentage per trade, and reward-to-risk ratio.
Displays clear colored boxes on the chart showing potential profit and loss zones.
Calculates position size and required leverage based on your risk settings.
Designed to work with your preferred strategies by simply connecting signal inputs.
Helps you visually manage trades with precise risk control and reward targets.
How to Use:
Connect your buy and sell signals (e.g., from Moving Average crossovers, custom scripts, or price levels) to the indicator’s inputs.
Adjust risk settings to fit your trading style (capital, risk %, reward ratio).
Watch as the indicator draws TP and SL zones on your chart when signals occur.
Use this information to set stops and targets in your trades confidently.
Perfect for traders who want simple, clear, and reliable trade management visuals based on their own strategy signals.

InspireHER Dynamic EMA RR Positioning IndicatorDynamic EMA and RR Positioning Indicator
This indicator is designed to provide traders with highly customizable buy and sell signals based on EMA (Exponential Moving Average) crossovers and Risk-to-Reward (RR) ratios. It works on any timeframe and allows users to toggle price data and additional position boxes for visualizing trade setups. Additionally, traders can choose between displaying dots or labeled signals for buy/sell indicators, making this tool versatile and user-friendly for different preferences and strategies.
What Makes This Indicator Unique
Customizable Parameters: The script offers extensive options for tailoring the indicator to your preferred trading style and strategy:
EMA: Configurable through settings (default is a 21-period EMA).
Risk-to-Reward Ratio (RR): Adjustable to meet your desired RR levels (default is 1:2.5).
Lookback Period: Visualizes buy/sell signals over the last six months.
Position Boxes for Trade Visualization: The indicator can "draw" position boxes on the chart, showing potential entry points, stop-loss (SL), and take-profit (TP) levels based on the selected RR. These visual aids simplify decision-making and help evaluate trade opportunities directly on the chart.
Price Data Toggle: Traders can choose to view or hide price data related to trade signals, including TP, SL, and RR values. By default, this is turned off to maintain a clean chart but can be activated when needed.
Flexible Signal Display Options:
Dots Mode: Displays buy signals as green dots and sell signals as red dots on the chart.
Label Mode: Displays buy signals as labels with the word "Buy" in green and sell signals as labels with the word "Sell" in red.
This toggle allows traders to customize how signals are displayed for a more personalized trading experience.
Simple Signal View: A toggle option provides a cleaner chart by enabling or disabling additional visual elements like circles or labels.
How It Works
Buy Signal: Triggered when the price crosses the EMA and closes above it.
Entry: Top of the candle.
Stop-Loss: Bottom of the candle.
Take-Profit: Calculated based on the selected RR.
Sell Signal: Triggered when the price crosses the EMA and closes below it.
Entry: Bottom of the candle.
Stop-Loss: Top of the candle.
Take-Profit: Calculated based on the selected RR.
Default Settings
EMA: 21-period.
Risk-to-Reward Ratio: 1:2.5.
Price Data: Off (can be toggled on in settings).
Position Boxes: Off (can be toggled on in settings).
Signal Display: Labels mode with "Buy" (green) and "Sell" (red) enabled by default; can be toggled to Dots mode.
Timeframe: Any timeframe supported.
How to Use
Add the Indicator to Your Chart: Once applied, the EMA line and buy/sell signals will appear by default.
Customize Settings: Navigate to the indicator's settings to adjust EMA, RR, or enable/disable Price Data, Position Boxes, or switch between Dots and Label modes.
Trade with Confidence: Use the visual aids and signals to assess trade opportunities based on your strategy and timeframe.
This indicator combines the reliability of EMA-based signals with the flexibility of configurable RR, visual trade setups, and multiple signal display options, making it a powerful tool for all types of traders. Happy Trading!!

Indian Market Sessions for BacktestingThis indicator is designed to increase the quality of your backtesting in the Indian Market.
NSE & BSE run from 9:15 am IST to 3:30 pm IST.
Naturally different times have different kinds of volatility.
On your chart you will find premarked -
Saffron - 9:15 am to 10:30 am - Opening Session - High Volatility Observed Historically
White - 10:35 am to 2:25 pm - Middle Session - Lower Volatility Observed Historically
Green - 2:30 pm to 3:30 pm - Closing Session - Medium to High Volatility Observed Historically
You will also find the start of each session marked with an arrow.
Feel free to change the times from the input settings and the color and visibility from the style settings.
_______________
Usage:
When you backtest any strategies, say moving average crossovers, also mark the sessions in your sheet which will help you further increase accuracy.
Feel free to drop your doubts in the comments.
